Why Your Waiters' Sales Numbers Lie
Server sales reports often miss the real story. Learn what actually matters for tracking performance and coaching your team effectively.
The 15-Minute Server Scorecard
The solution is a one-page report that shows three numbers: average check size, items per guest, and return rate from their section. Print this scorecard before every shift briefing. Show servers their numbers from yesterday's service. Keep it visible at the pass during service - not hidden in an office spreadsheet.
The Rule: Stop rewarding servers for pushing expensive specials. Instead, track how many guests from their section come back within 30 days. A server who sells $1,500 but brings 40% of their guests back is more valuable than one who sells $2,000 with 10% returns.
This connects to the broader system of actionable metrics we cover in Restaurant Reports That Actually Work, which breaks down which numbers actually drive decisions.
Here is how you build the scorecard manually. Take last night's guest checks from one server's section. Add up total sales and divide by number of guests. That is average check size. Count total menu items sold and divide by guests. That is items per guest. For return rate, you need a simple reservation book or host stand notation system - a star next to returning guests who request the same server.
The magic happens in the pre-shift meeting. You hand Sarah her scorecard: $42 average check, 2.3 items per guest, 35% return rate. You hand Mike his: $58 average check, 1.8 items per guest, 12% return rate. Now you see the real story. Sarah builds larger orders through better service and timing. Mike pushes one expensive item but leaves guests feeling rushed.
You coach based on these numbers. "Sarah, your return rate is highest on the floor. What are you doing with dessert timing?" "Mike, your average check is strong but guests aren't coming back. Let's work on your wine presentation approach." The data starts conversations instead of ending them.
When Paper Reports Break Down
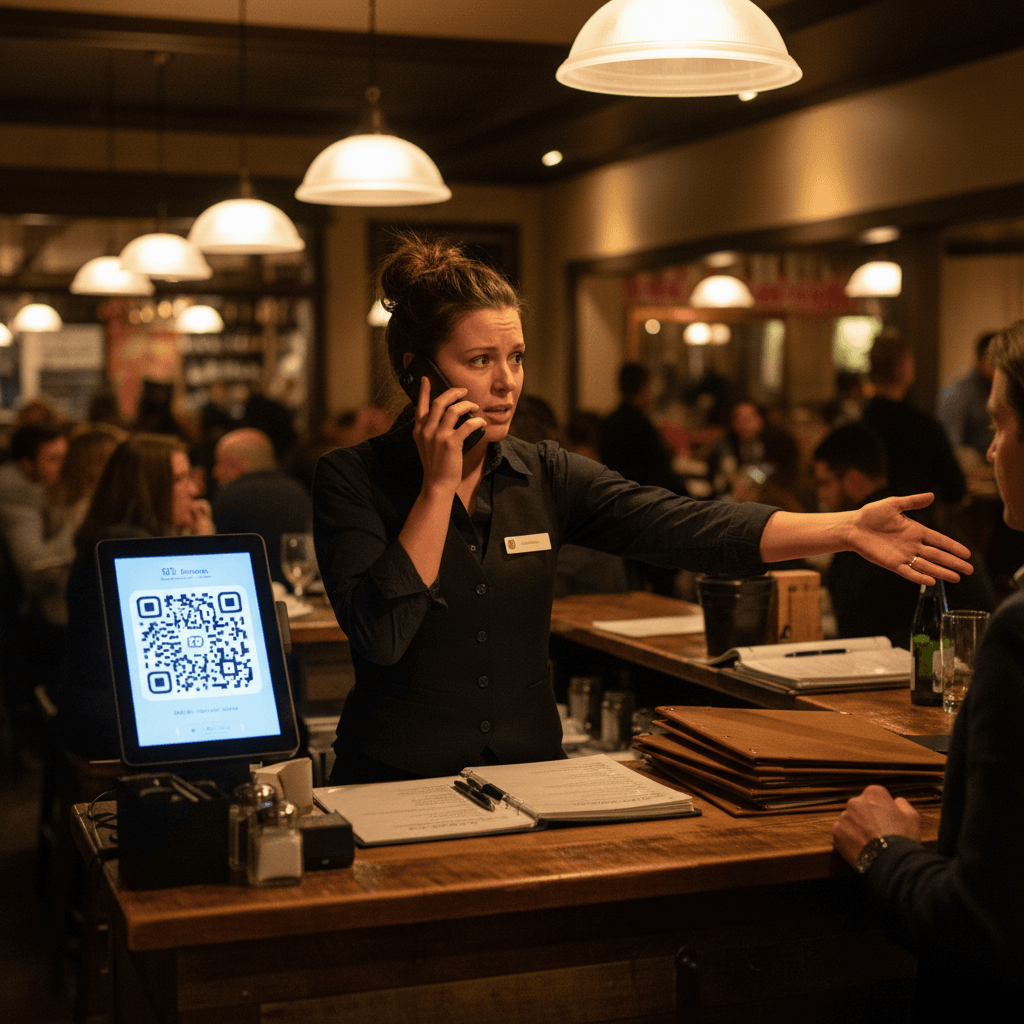
The manual system works until Friday night rush hits. Three servers call out sick. Two large parties walk in without reservations. Suddenly you're running food, seating guests, and trying to remember which server sold that bottle of wine to table 12.
The handwritten notes get lost between the host stand and the kitchen. The scorecards pile up unread on your desk because you spent Sunday recovering from the weekend chaos instead of analyzing numbers. You try to piece together who performed well when all you remember is the fire you put out at table seven.
This breakdown follows a predictable pattern. Monday through Thursday, you track diligently. Friday hits, and survival takes priority over data collection. By Saturday night, you are too deep in the weeds to note which server handled that difficult eight-top with grace versus which one created the problem. The system collapses under its own weight because it relies on human memory during peak stress.
The cost is real coaching opportunities lost. That new server who excelled during the rush but whose performance got buried in the chaos? You miss the chance to reinforce what worked. The veteran who pushed too hard and turned a table? You forget to address it before they repeat the mistake next Friday.
From Tracking to Coaching
The best sales tracking becomes coaching conversations, not punishment tools. Use the numbers to ask questions instead of delivering verdicts: "I noticed your average check was lower but your return rate was highest - what are you doing differently with your greeting?"
Share what works across the team. When one server consistently sells more appetizers without pressure, have them demonstrate their approach during pre-shift. "Watch how Jessica presents the specials board - she connects each item to a guest's earlier comment." Turn data into shared success instead of individual competition.
Start with one metric that matters most to your restaurant - probably guest return rate. Track it manually for two weeks until you see patterns emerge across shifts and servers. Then build from there by adding average check or items per guest once the first metric becomes routine.
The manual process requires discipline, but modern digital tools can automate the repetitive tracking work that breaks down during busy services. Systems that capture sales data automatically and calculate performance metrics eliminate the Sunday morning spreadsheet scramble, letting you focus on coaching conversations instead of data entry.
Taking the Next Step
Tracking waiter performance effectively requires shifting from simple sales totals to metrics that reflect real guest experience and long-term value. The logic is clear once you separate short-term revenue from sustainable restaurant success.
If manual tracking feels overwhelming during peak service, explore how automated systems capture this data seamlessly view our pricing or start a free trial to see how digital tools handle the tracking while you focus on coaching your team through actual performance patterns rather than guesswork after a chaotic shift ends.