Menu Engineering: The Real Math Behind Profitable Plates
Stop guessing what sells. Learn how to analyze your menu like a pro, identify hidden profit killers, and design dishes that actually make money.
The Hidden Tax on Every Plate You Serve
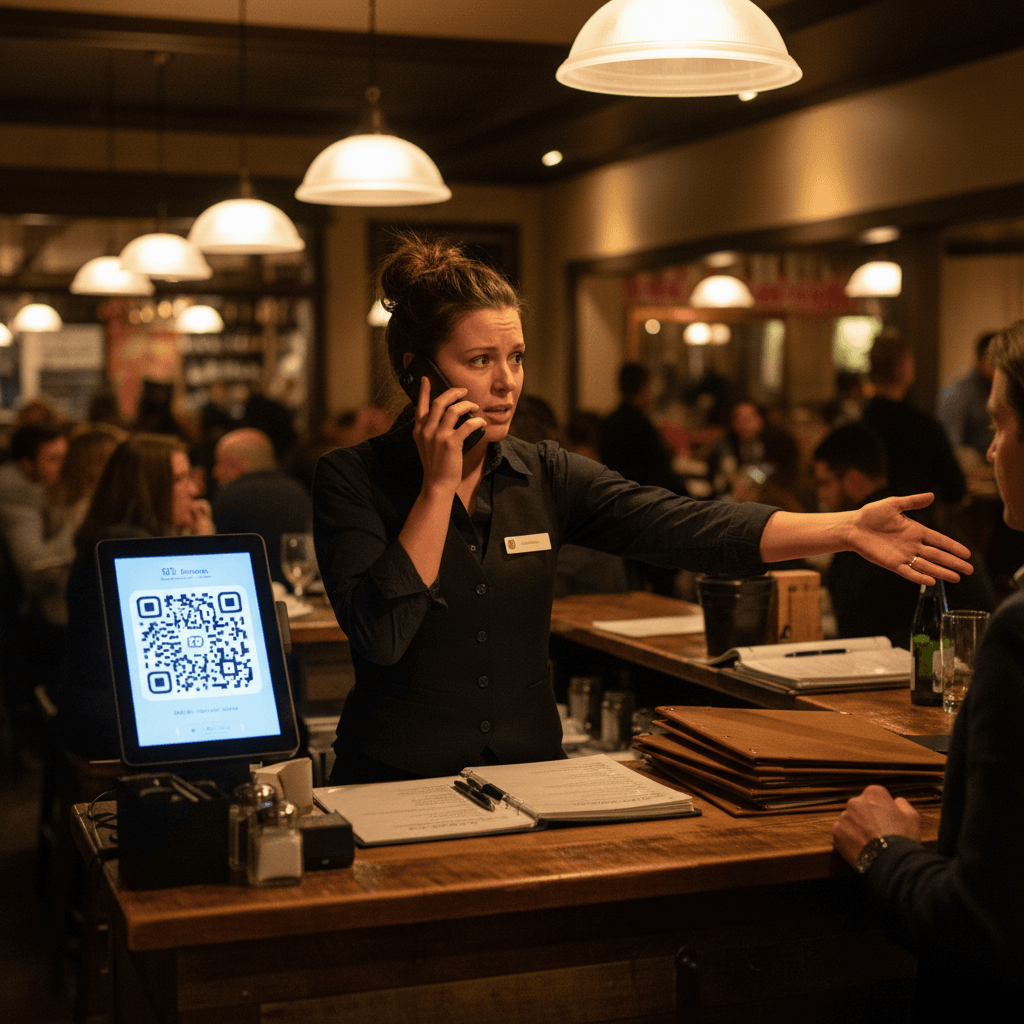
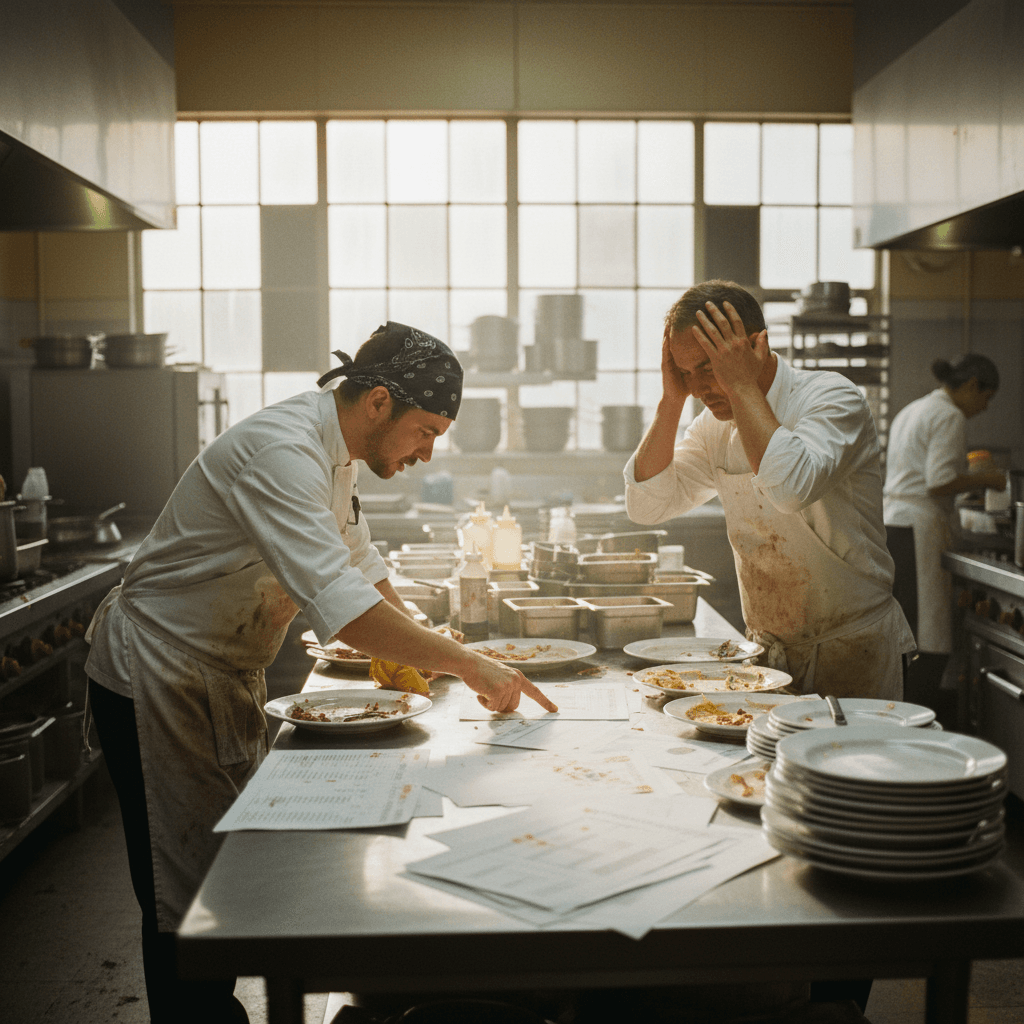
The Friday dinner rush is in full swing. The expo station is calling three orders at once. The printer is spitting tickets. The dining room is full. At the end of the night, you count the cash. The number doesn't match the feeling. You moved a lot of food, but your bank account didn't move much at all. This is the hidden tax of poor menu engineering.
Every popular dish on your menu carries a cost beyond its ingredients. That $24 steak sells well. But it takes 18 minutes to cook, occupies your best grill space, and pushes a faster, higher-margin pasta dish off the line. You see the sales. You don't see the opportunity cost. The real profit killers are not the slow movers you already watch. They are the popular items that quietly drain your resources.
You know the problem. Here's why your current fix fails.
When Your Gut Betrays Your Bottom Line
You trust your experience. You've run this place for years. You know the chicken sells on Tuesdays and the fish special moves on Fridays. Your gut is right about what customers order. It is almost always wrong about what makes you money.
Manual tracking fails because it misses connections. You track food cost for each dish in a spreadsheet. You look at sales reports from your POS. These are two separate lists. They never meet. That $24 steak might have a 28% food cost, which looks good on paper. But you don't see that every time it sells, two servers get tied up running sides and sauces, your grill cook falls behind on other tickets, and you sell one less $18 pasta dish that has a 22% food cost and takes 6 minutes to plate.
Hard Truth: Most restaurants waste more money on poorly engineered menus than they do on food waste or theft. Waste and theft are visible losses. A bad menu is an invisible leak that happens every time you open your doors.
That's the trap. This is how you escape it.
The Four-Quadrant Reality Check
Forget complex formulas and consulting jargon. Menu engineering works with four boxes drawn on a napkin. You need two pieces of data for every menu item: how profitable it is, and how often it sells.
First, calculate contribution margin for each dish. Contribution margin is what's left after food cost. A $16 steak that costs $5 to plate has an $11 contribution margin. That's your real profit per plate before labor and overhead.
Second, pull sales mix percentage from your POS for the last full month. What percent of total sales did each item represent?
Now plot every dish on a simple grid: high profit vs low profit on one axis, high sales vs low sales on the other.
Stars are high profit, high sales. These are your best items. Protect them, feature them, and make sure they never run out. Plowhorses are low profit, high sales. They sell constantly but don't make much money each time. Puzzles are high profit, low sales. They make great money when they sell, but nobody orders them. Dogs are low profit, low sales.
The Rule: Run this analysis with real data from your POS every quarter. Guessing where items fall is how you lose money.
Contrarian Opinion: Getting rid of 'dogs' isn't always the right move. Sometimes those low-profit items are what bring people in the door or complete a section of your menu. A basic burger might be a dog, but if you take it off, you lose the table that comes for the burger eater while their friends order steaks and wine. The goal isn't elimination - it's strategic placement and pricing.
You have your map of profit and popularity. Now you need to use it during service.
The Friday Night Test: Engineering in Action
It's 7 PM on a Friday. The host stand has a waitlist. This is where menu engineering moves from spreadsheet to service.
Start with menu layout psychology. Customers' eyes travel in predictable patterns - often to the top right of a menu section first, then down the right-hand side. Place your Stars and high-profit Puzzles in these prime locations. Move Plowhorses to less prominent spots where regulars will still find them.
Use descriptive language that sells without sounding cheesy. Weak: "Grilled Chicken Breast." Strong: "Oak-Grined Chicken Breast with rosemary roasted potatoes and lemon-thyme jus." The second version uses specific cooking methods (oak-grilled), ingredients (rosemary, lemon-thyme), and preparation (roasted). It adds perceived value without adding food cost.
Train servers to guide choices without being pushy. Give them one script for each quadrant. For a Star: "The cedar-plank salmon is our most popular dish tonight, and for good reason." For a Puzzle: "If you're looking for something truly special, the wild boar ragu is incredible." For a Plowhorse: "The classic spaghetti is always a reliable choice." This isn't upselling; it's informed guidance based on what actually benefits the house.
During that Friday rush, these small changes add up. A server guides two tables toward the high-profit Puzzle instead of the low-profit Plowhorse. The menu layout causes three more guests to order the Star entree without any server interaction. You've just added $50 of pure contribution margin in one hour without raising a single price or changing a recipe.
The theory works during a rush. Now build it into your routine.
From Spreadsheet to Service: Your 30-Day Action Plan
This isn't about overnight transformation. It's about sustainable improvement that shows up in your bank statement in four weeks.
Week 1: Gather Data. Export one full month of sales data from your POS system. Calculate food cost for every single menu item. Do not estimate. Pull actual invoices and do the math. Combine this with your sales mix report to plot every dish on the four-quadrant grid.
Week 2: Categorize & Strategize. Label each item: Star, Plowhorse, Puzzle, or Dog. Make three strategic changes only. Not twenty. Example changes: 1) Move one Star item to a more prominent menu position. 2) Add descriptive language to one Puzzle item and give servers a simple script to mention it. 3) Test a slight price increase on one Plowhorse that you know won't scare away regulars.
Week 3: Implement & Train. Brief your staff at one pre-shift meeting. Explain the "why" simply: "We want to highlight dishes that are both delicious and help us run smoothly." Give servers their one script each. Print new menus if you changed layout. Do not overhaul everything at once.
Week 4: Measure & Adjust. After two weeks of service with these changes, pull sales data again. Did the moved Star sell more? Did the described Puzzle move off the menu? Did the priced Plowhorse maintain its sales volume? Adjust one thing based on what you learn. Then leave it alone for another quarter.
The goal is incremental progress you can measure. One changed item adding $2 more contribution margin per sale, multiplied by selling 30 times per week, equals $240 more per week, or over $12,000 more per year from one small adjustment. That's how menu engineering works.
Taking the Next Step
The shift from guessing to knowing is inevitable once you see the math behind every plate. The logic of aligning popularity with profitability is simple and undeniable. Your operation becomes calmer because decisions are based on data, not stress during a rush.
Menu engineering transforms hidden costs into visible profit. If you are ready to analyze your menu with real sales data and stop guessing what makes money, you can view our pricing to fit your budget, or start a free trial to test it during your next service